Dogecoin’s Fate Hinges On This Price Level, Analysts Agree

Reason to trust
![]()
Strict editorial policy that focuses on accuracy, relevance, and impartiality
Created by industry experts and meticulously reviewed
The highest standards in reporting and publishing
Strict editorial policy that focuses on accuracy, relevance, and impartiality
Morbi pretium leo et nisl aliquam mollis. Quisque arcu lorem, ultricies quis pellentesque nec, ullamcorper eu odio.
Dogecoin is probing its most-contested price shelf of 2025, and two respected technicians— Cantonese Cat (@cantonmeow) and ANBESSA (@Anbessa100)—have reached the rare point where their short-term and high-time-frame road maps overlap almost perfectly.
Dogecoin Just Hit Its Make-Or-Break Zone
Cantonese Cat’s daily chart, published late on June 2, highlights a turquoise demand band stretching from $0.1850 to $0.1950. That ribbon has flipped roles repeatedly since February: first cushioning the price action in late-February, and then capping March and April’s rebounds.
Related Reading
After last week’s four-day decline, three successive bodies have closed inside the rectangle while intraday wicks penetrated its floor—forming what the analyst dubbed a “trident bottom”.
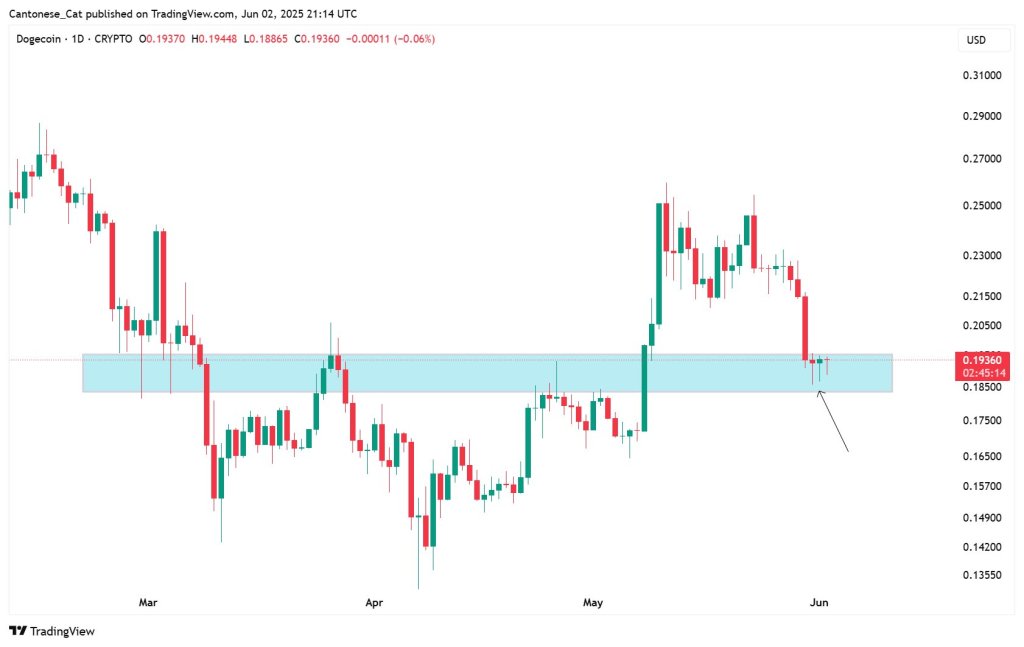
As Cantonese Cat put it: “It’s not a tweezer bottom; it’s a trident bottom to test demand. Now let’s see if $DOGE forks it all up from here.” A daily close above the upper edge would re-expose the early-May breakdown gap at $0.1950–0.2150; a decisive slip beneath $0.1850 would bring the April low near $0.13 back into contention.
Parabolic Curve Continues To Predict All-Time High
ANBESSA’s one-day schema—also dated June 2—places the same price action in a fifteen-month context. The chart begins with the September 2024 spot entry at roughly $0.09 and follows an explosive rally that carried Dogecoin 413% higher, a move annotated as 0.3892 on the graph.
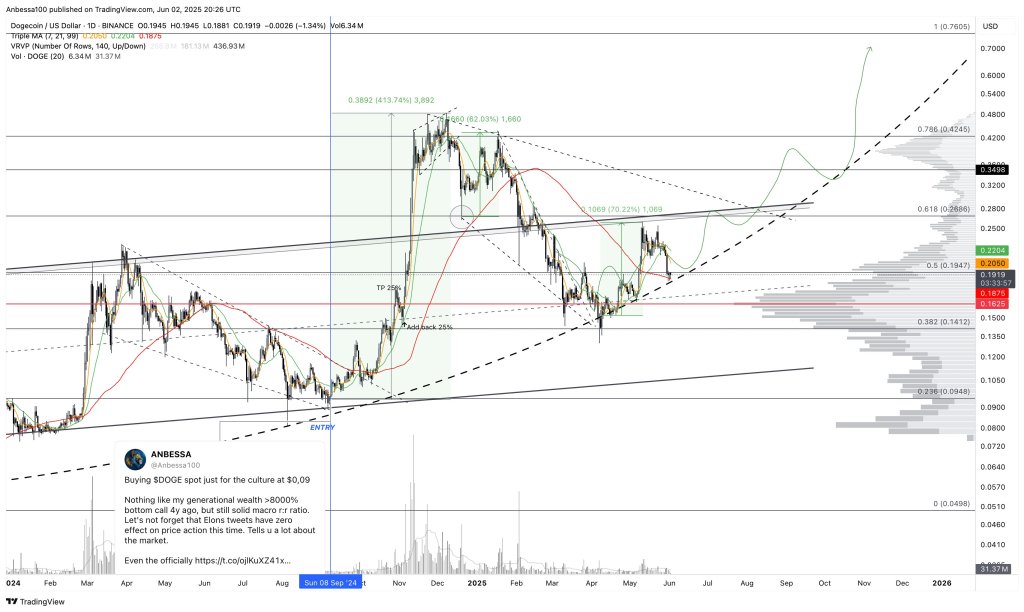
What followed was a three-wave retracement that unwound 73% of that advance, then a counter-trend rally of 70.22% to $0.2597. From ANBESSA’s perspective, the current sell-off is a textbook correction to the 0.382 Fibonacci retracement of the entire move at $0.1412, intersecting both the rising parabolic guide-curve and the 99-day moving average (red).
“Still perfectly in sync with my projection… a clean 80 % bounce, followed by a textbook throwback to the 0.5 fib and 99 MA Daily (parabola retest), exactly as projected. In a bull market, dips are made for buying,” the analyst wrote, adding the reminder to keep “HTF risk-management below POC.”
Related Reading
Volume-profile bars on the right side of ANBESSA’s chart emphasise why both traders care so much about the twenty-cent neighbourhood: the point of control (POC) sits just above $0.20, framing the single deepest pocket of historical trading interest since 2024.
Above that pivot, the next Fibonacci magnet is the 0.618 level at $0.2686, immediately followed by an ascending trendline near $0.28. Notably, this region is dense with resistance as another descending trend-line drawn from the December-January highs sits around $0.29-$0.30.
A successful break of this zone would project to the heavy‐volume shelf at $0.3498 and, further out, the 0.786 retracement at $0.4245. Conversely, failure at the current confluence would expose the 0.382 retracement at $0.1412, with an intermediate control zone flagged on ANBESSA’s chart at $0.1625.
Momentum is neutral for now: the Triple-MA ribbon (7-, 21-, 99-day) on ANBESSA’s chart has compressed, and daily RSI (not shown) hovers in the mid-40s. In other words, price alone will settle the debate.
Cantonese Cat’s microstructure “trident” and ANBESSA’s macro-structure “throw-back” both place the battleground inside the same cent band. Whether Dogecoin has in fact printed its correction low will be revealed by what traders do— and just as crucially, where the next daily candle closes—in that $0.1850–$0.1950 corridor.
At press time, DOGE traded at $0.196.
Featured image crated with DALL.E, chart from TradingView.com
#Dogecoins #Fate #Hinges #Price #Level #Analysts #Agree
Jake Simmons


